RNA-Binding Proteins (RBPs) and Alternative Splicing (AS)
Single-cell transcriptomics has revolutionized our understanding of the brain, including cell types, cell states, and developmental trajectories. Yet, recent work, including our own, demonstrated that the transcriptome alone is insufficient, as brain cells have evolved extensive post-transcriptional programs to regulate gene expression in space and time. Thus, it is paramount to identify cell type-specific post-transcriptional programs and assess whether they drive functional differences between cell types. Using Ribo-STAMP, we discovered that hundreds of genes display similar mRNA levels in CA3 and CA1 PNs, but are translated significantly higher in CA3, a feature that seems to be driven, at least in part, by neuronal activity (Sison*, Zampa*, Kofman*, et al. Nature 2026). Similarly, many transcript isoforms that are expressed at similar levels in astrocytes and oligodendrocytes display higher translation in astrocytes (Figure 1). Motif analysis of these isoforms revealed enrichment of predicted binding sites for Pabc1, Pabc4, Sart3, and Hnrnpr, RBPs involved in positive translational regulation. These RBPs are expressed at higher levels in astrocytes compared to oligodendrocytes, possibly sustaining increased translation of the targets in this cell type.
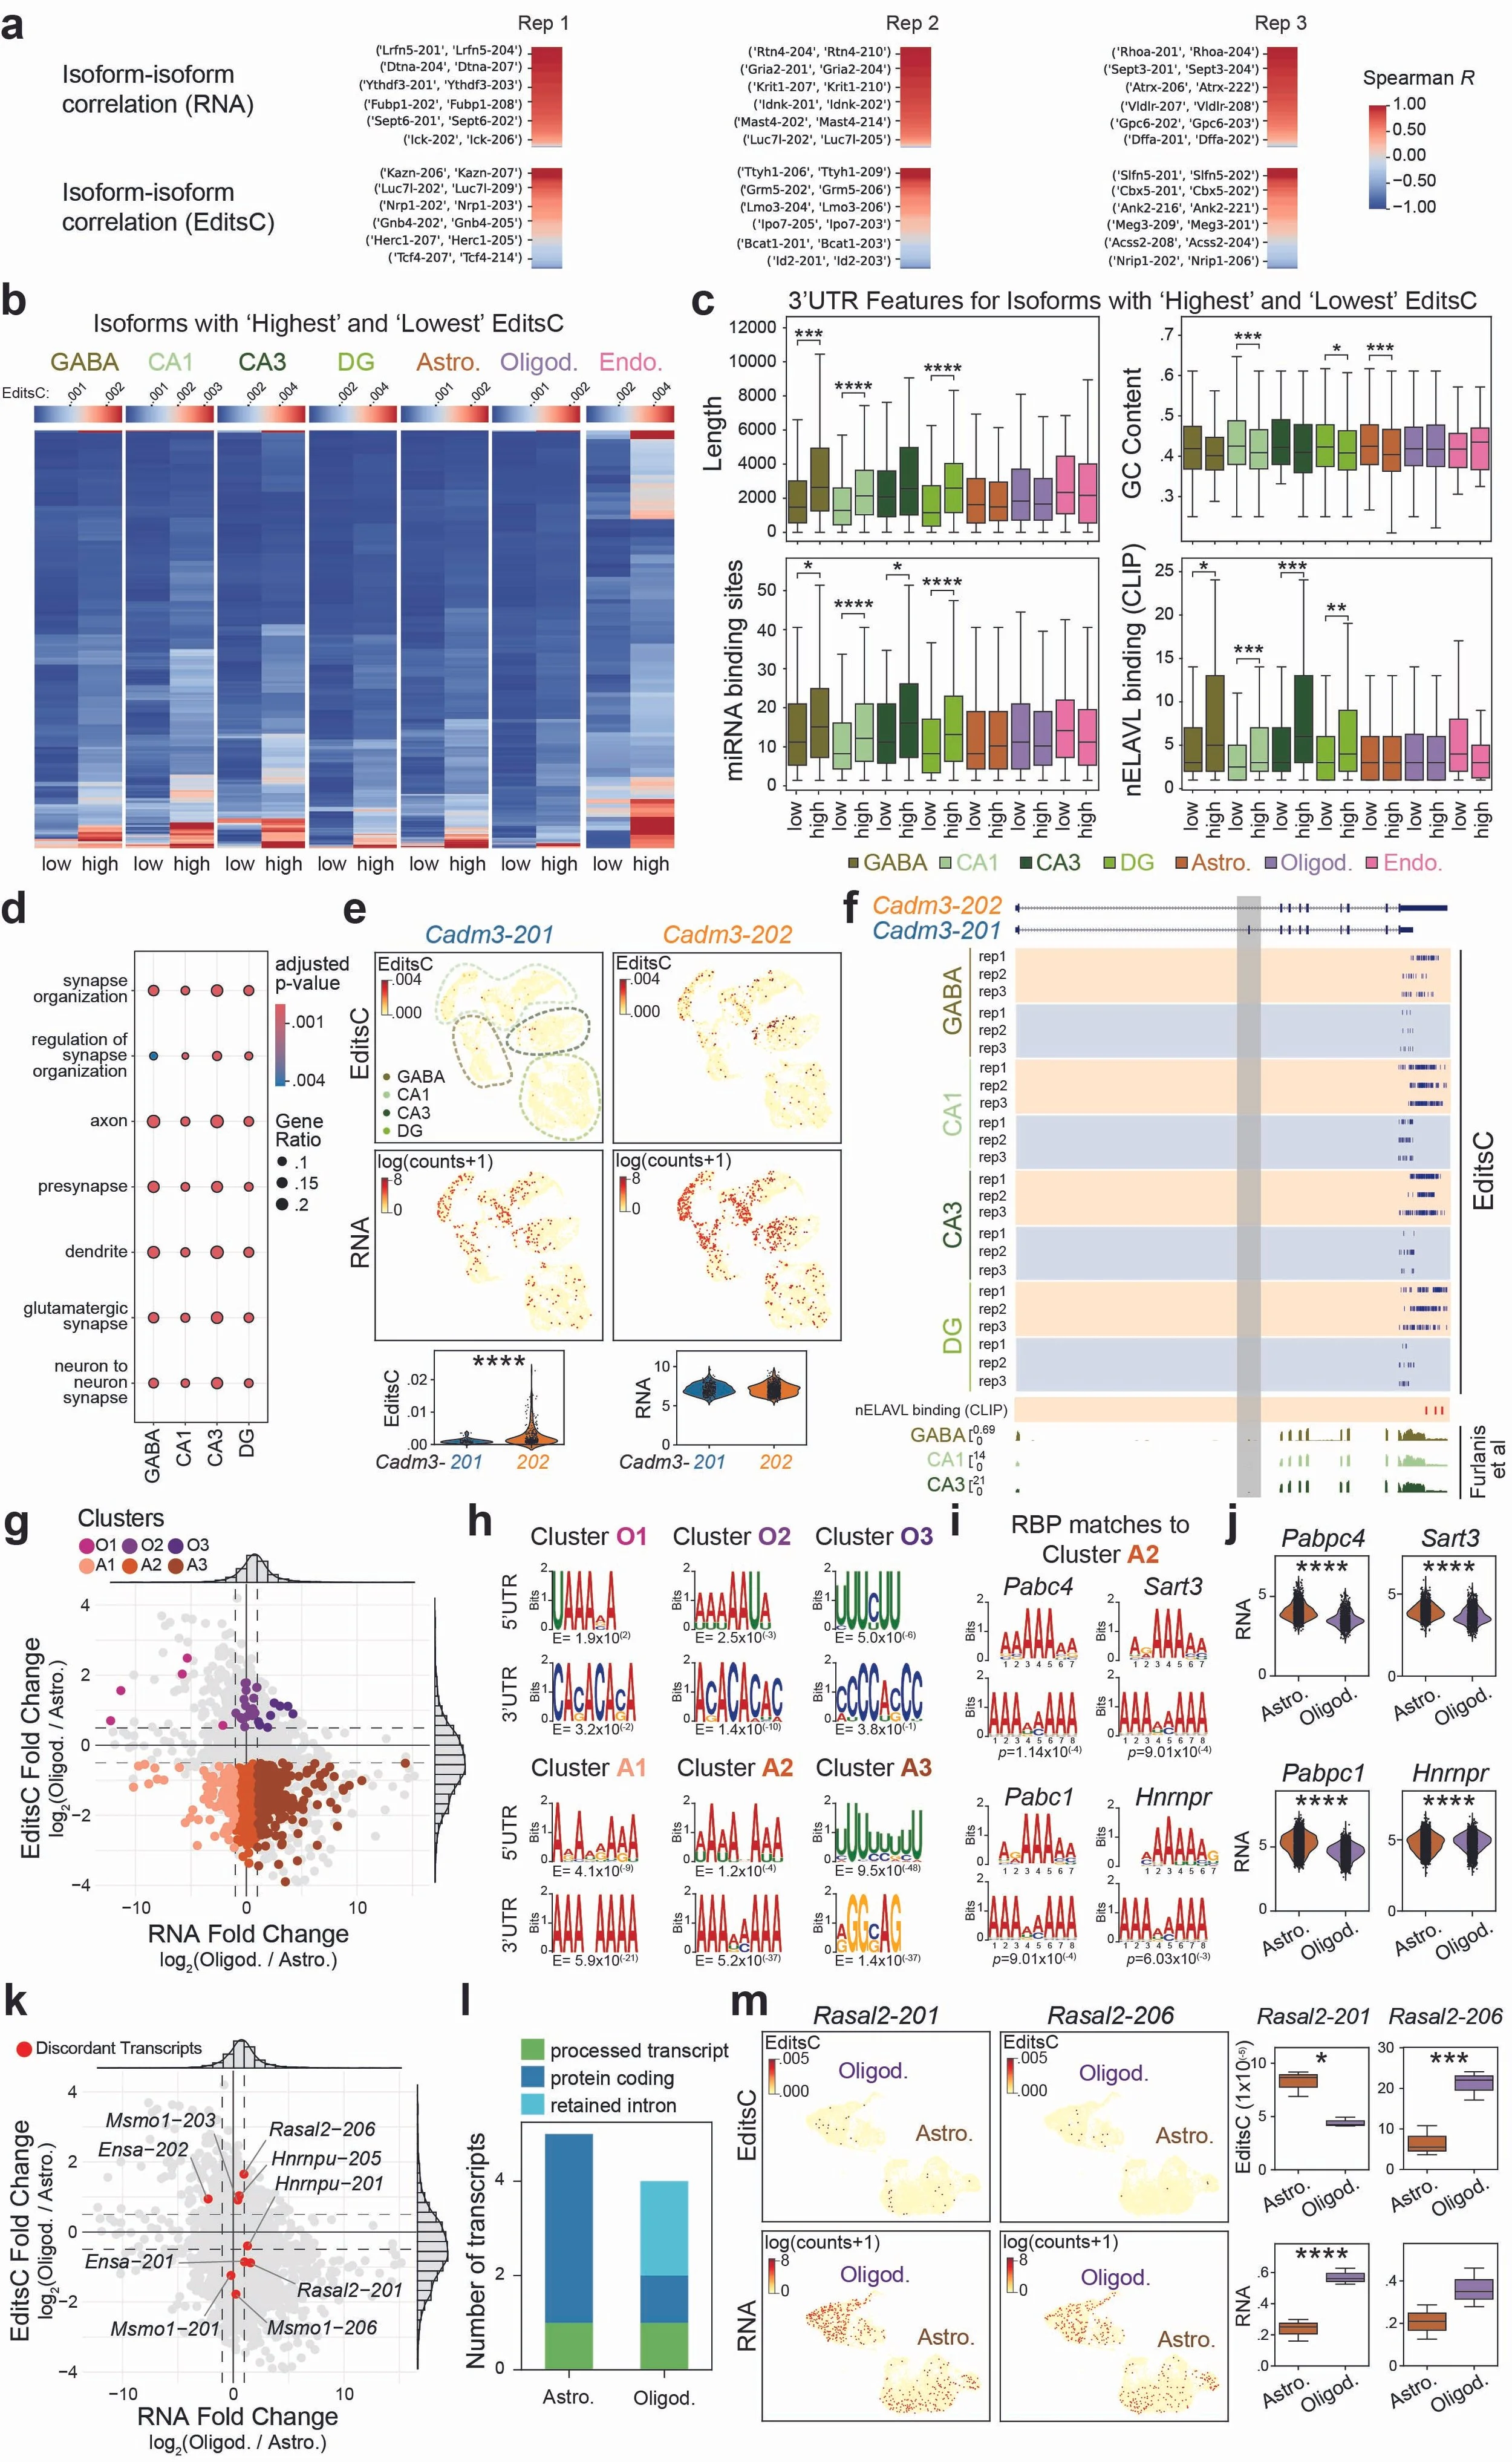
Figure 1. Ribo-STAMP paired with long-read scRNA-seq measures the translational potential of different isoforms. A. RNA counts and EditsC pairwise Spearman correlations between isoforms from the same gene across cell types. B. EditsC for isoforms from the same gene with highest and lowest translation. C. Transcript feature analyses of 3′ UTRs from transcripts in B. D. Gene Ontology analysis of transcripts in B for neuronal cell types. All ontologies were selected. E. EditsC and RNA UMAPs (top) and quantifications (bottom) for isoforms Cadm3-201 and Cadm3-202. F. IGV browser tracks showing edits detected on Cadm3-201 (blue) and Cadm3-202 (orange) isoforms. nELAVL CLIP binding sites highlighted in red. Tracks from RiboTag (bottom). Cadm3-202-specific exon is highlighted in grey. G. Differential EditsC and RNA expression analysis for Oligod. versus Astro. H. Top enriched motifs found in each cluster. I. Example RBPs enriched motifs on 3′ UTR top enriched motif in cluster A2. J. RNA expression of RBPs found in I in Oligod. and Astro. K. Same scatterplot as in G highlighting isoforms of the same gene undergoing significant differential translation in Oligod. versus Astro. L. Transcript biotypes of isoforms in K regardless of P-value. M. EditsC and RNA UMAPs (left) and quantifications (right) for isoforms Rasal2-201 and Rasal2-206.