
Technologies to Study Post-Transcriptional Mechanisms
To enable new discoveries, we first had to overcome the lack of tools with a spatiotemporal resolution matching both the fast pace of neuronal development and function and the high diversity of neuronal subtypes in mammals. To fill this gap, we have engineered multiple new high-resolution technologies to map and manipulate microRNA-target interactions (MTIs), and to measure the mismatch between transcription and translation. Specifically:
1. Rapid, inducible, and reversible global microRNA loss-of-function. The classic approach to identify global microRNA roles in specific cell types is to stop their biogenesis (e.g., conditional Dicer knockout) and assess functional consequences. However, since neuronal microRNAs often display long half-life, these approaches are slow onset, thus masking critical microRNA roles during neuronal development. Taking advantage of technology developed by the Meister lab (TNRC6B-related peptide – T6B), we engineered an inducible and reversible peptide (DD-T6B; Figure 1) that blocks the assembly of the RISC complex. DD-T6B induces global microRNA loss-of-function within hours of administration of the small molecule TMP. If TMP is not administered again, microRNA function can be reversed to normal within 24 hours (Zolboot*, Xiao* et al. Neuron 2025), giving us exquisite temporal control over microRNA function during development and in the adult. We have now used DD-T6B to identify previously unknown critical windows for microRNA function in Purkinje Cell (PC) dendritogenesis and climbing fiber synaptogenesis, layer 2/3 PN contralateral axonal invasion (Zampa et al. in preparation), cortical GABAergic interneurons migration and fate (Du et al. in review), and retinal ganglionic cells axonal refinement. The identification of critical windows for microRNA function is the necessary starting point to understanding the underlying mechanisms through mapping and manipulation of the microRNA-target network.
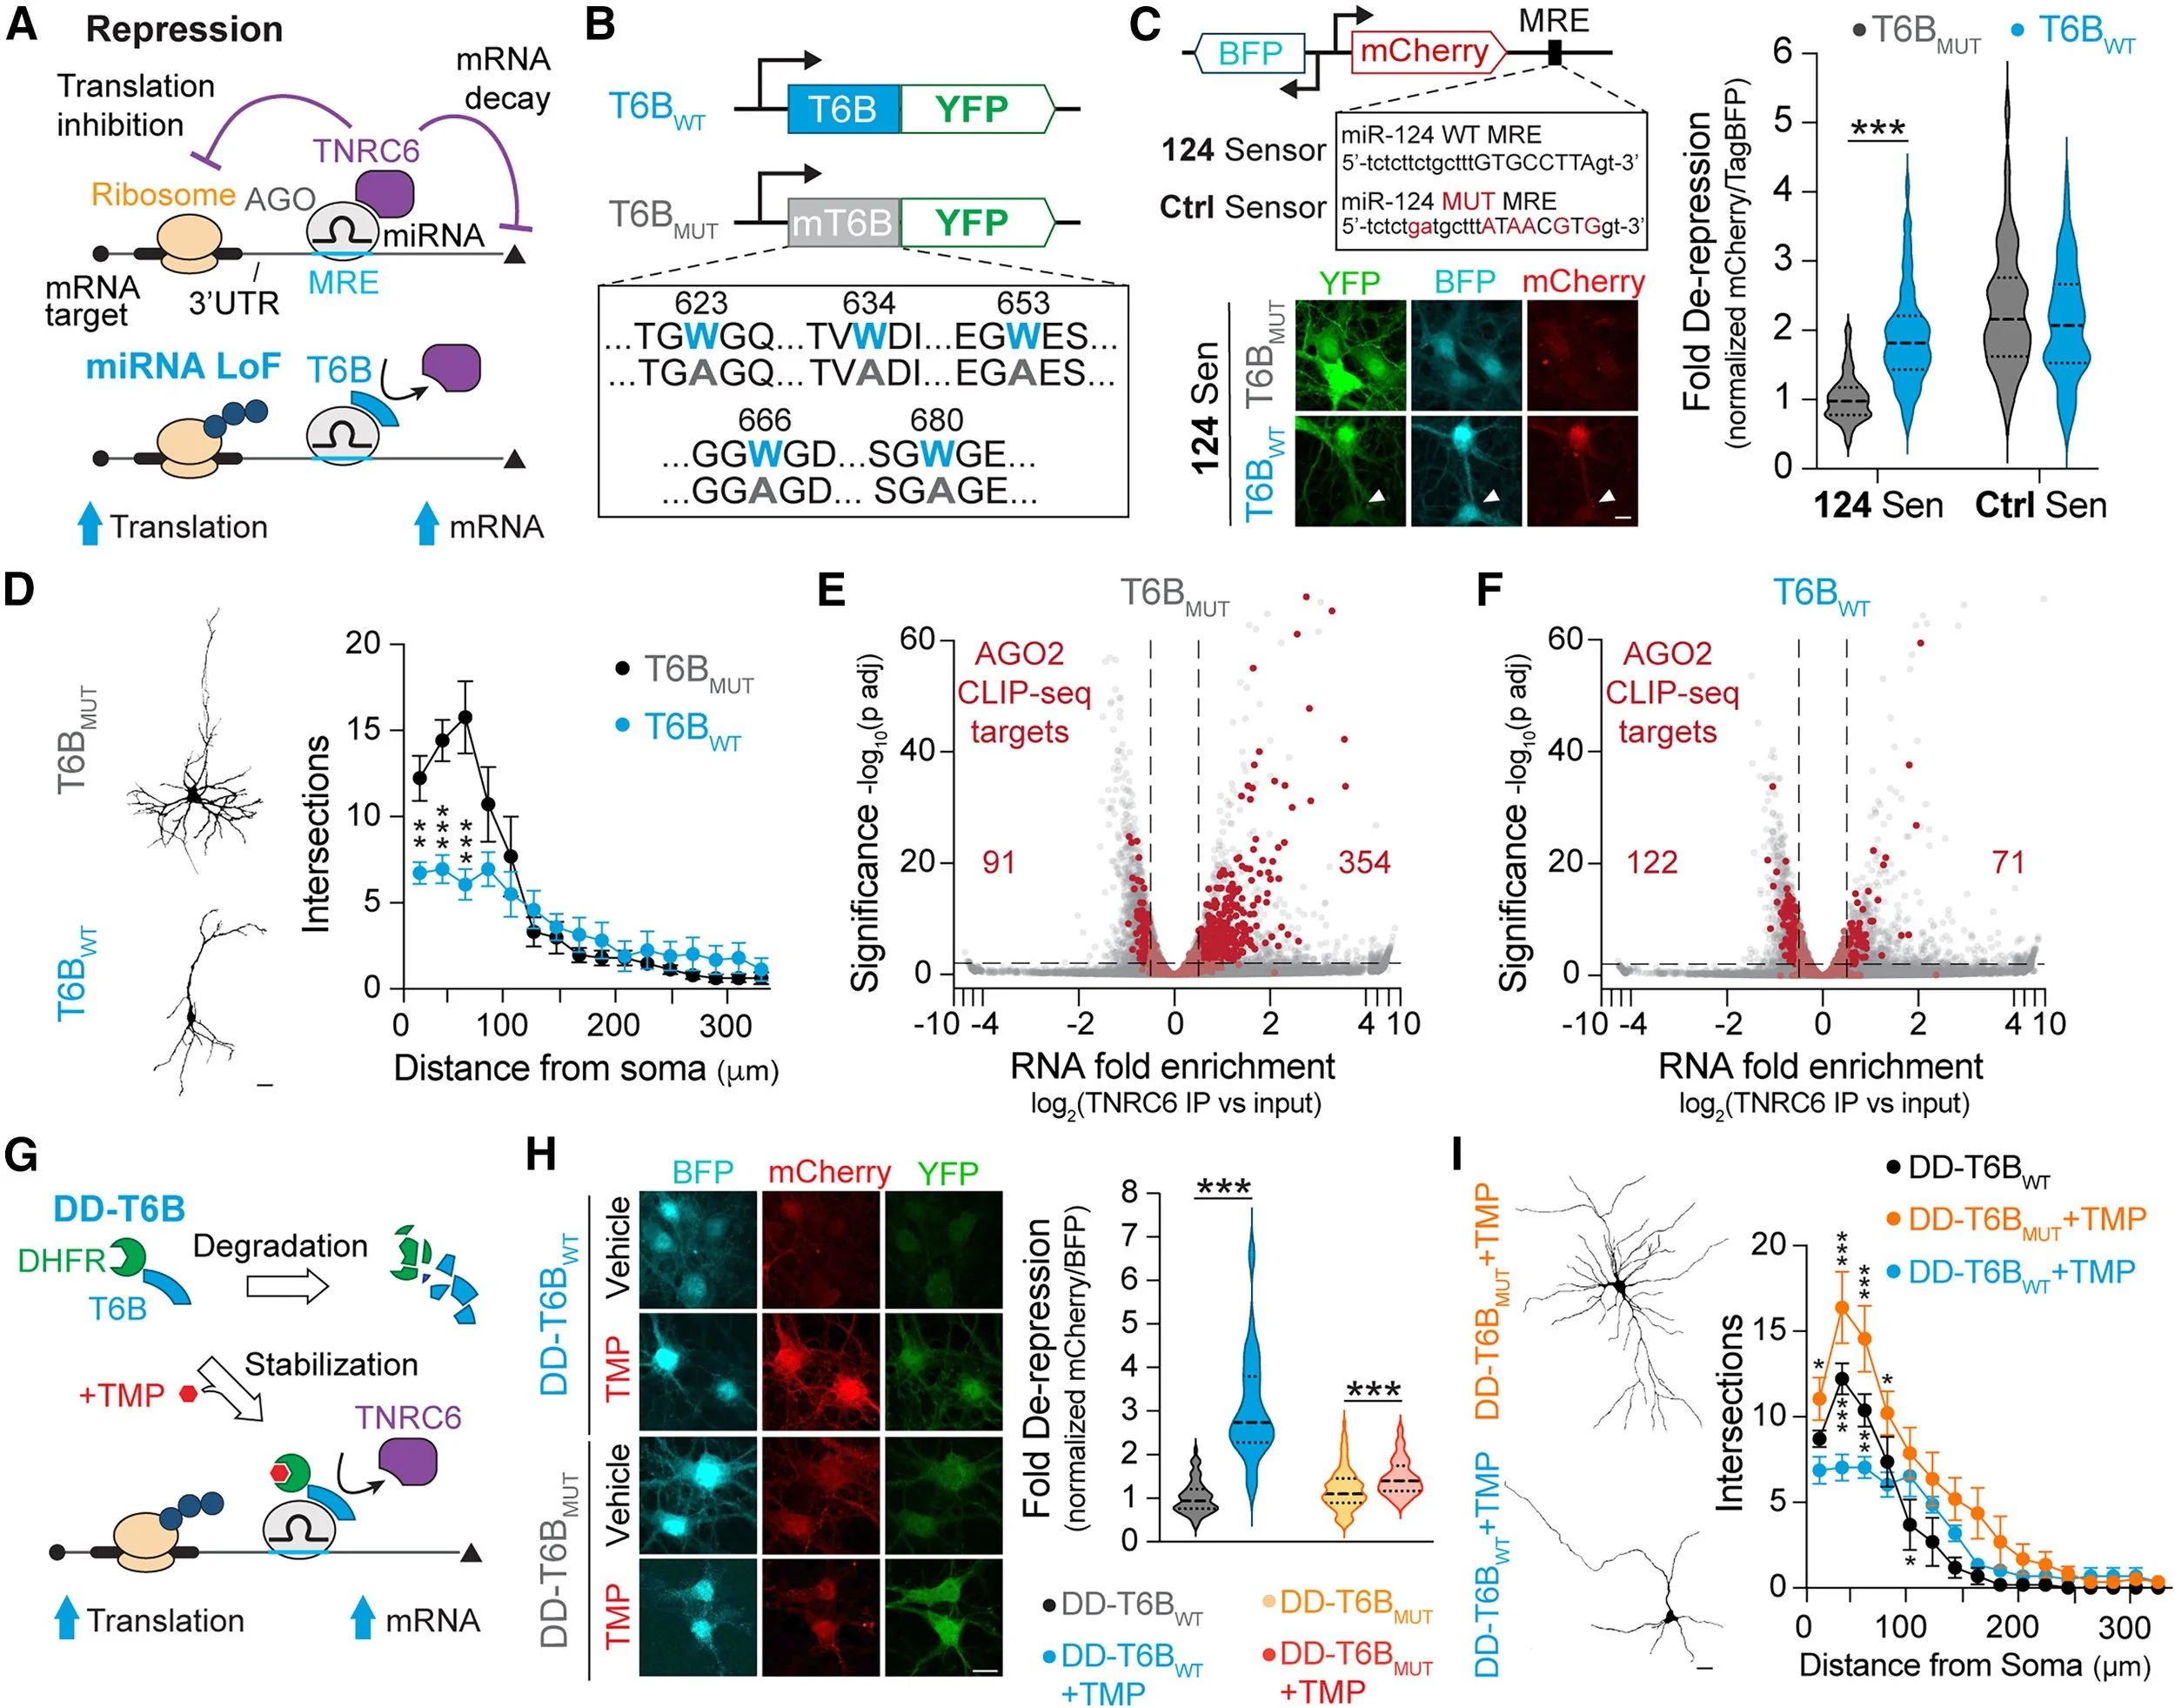
Figure 1. Inducible/reversible microRNA loss-of-function. A. T6B outcompetes TNRC6 binding to AGO to induce microRNA LoF. B. Amino acid sequence difference between wild-type T6B and the mutated T6B. C. Dual-fluorescence microRNA sensor. Functional validation of T6B in cultured cortical PNs using the 124 Sen. Note that while mCherry is de-repressed with T6B, mCherry remains repressed in neurons not expressing T6B (white arrow). E-F. Volcano plot showing transcripts pulled down with TNRC6 in DIV14 PNs transduced with T6B. microRNA targets identified by AGO2 CLIP-seq (1,656 total) are shown in red. G. Schematic of DD-T6B function. H. Functional validation of DD-T6B in PNs using the 124 Sen. I. Effect of DD-T6B on PN dendritic complexity. From Zolboot*, Xiao* et al. Neuron 2025.
2. MTI mapping. Neuronal subtypes express different transcriptomes and microRNA repertoires; however, whether their MTIs are different and whether these differences matter for their specific development remains unknown. In collaboration with Ian MacRae (Scripps), we created a mouse line in which the Argonaute 2 (Ago2) gene, the main effector of microRNA function, is conditionally tagged in cells expressing the Cre recombinase, and developed SAPseq (Spy3 Ago2 Pulldown), the first technology that allows for MTI mapping from rare cell types (e.g., PCs are ~1% of cells in the cerebellum; Figure 2). We demonstrated that SAPseq vastly outperforms existing technologies without affecting microRNA biogenesis or function (Zolboot*, Xiao* et al. Neuron 2025), yielding the first PC-specific microRNA-target network, a critical first step to understanding how PC-specific post-transcriptional programs drive their identity.
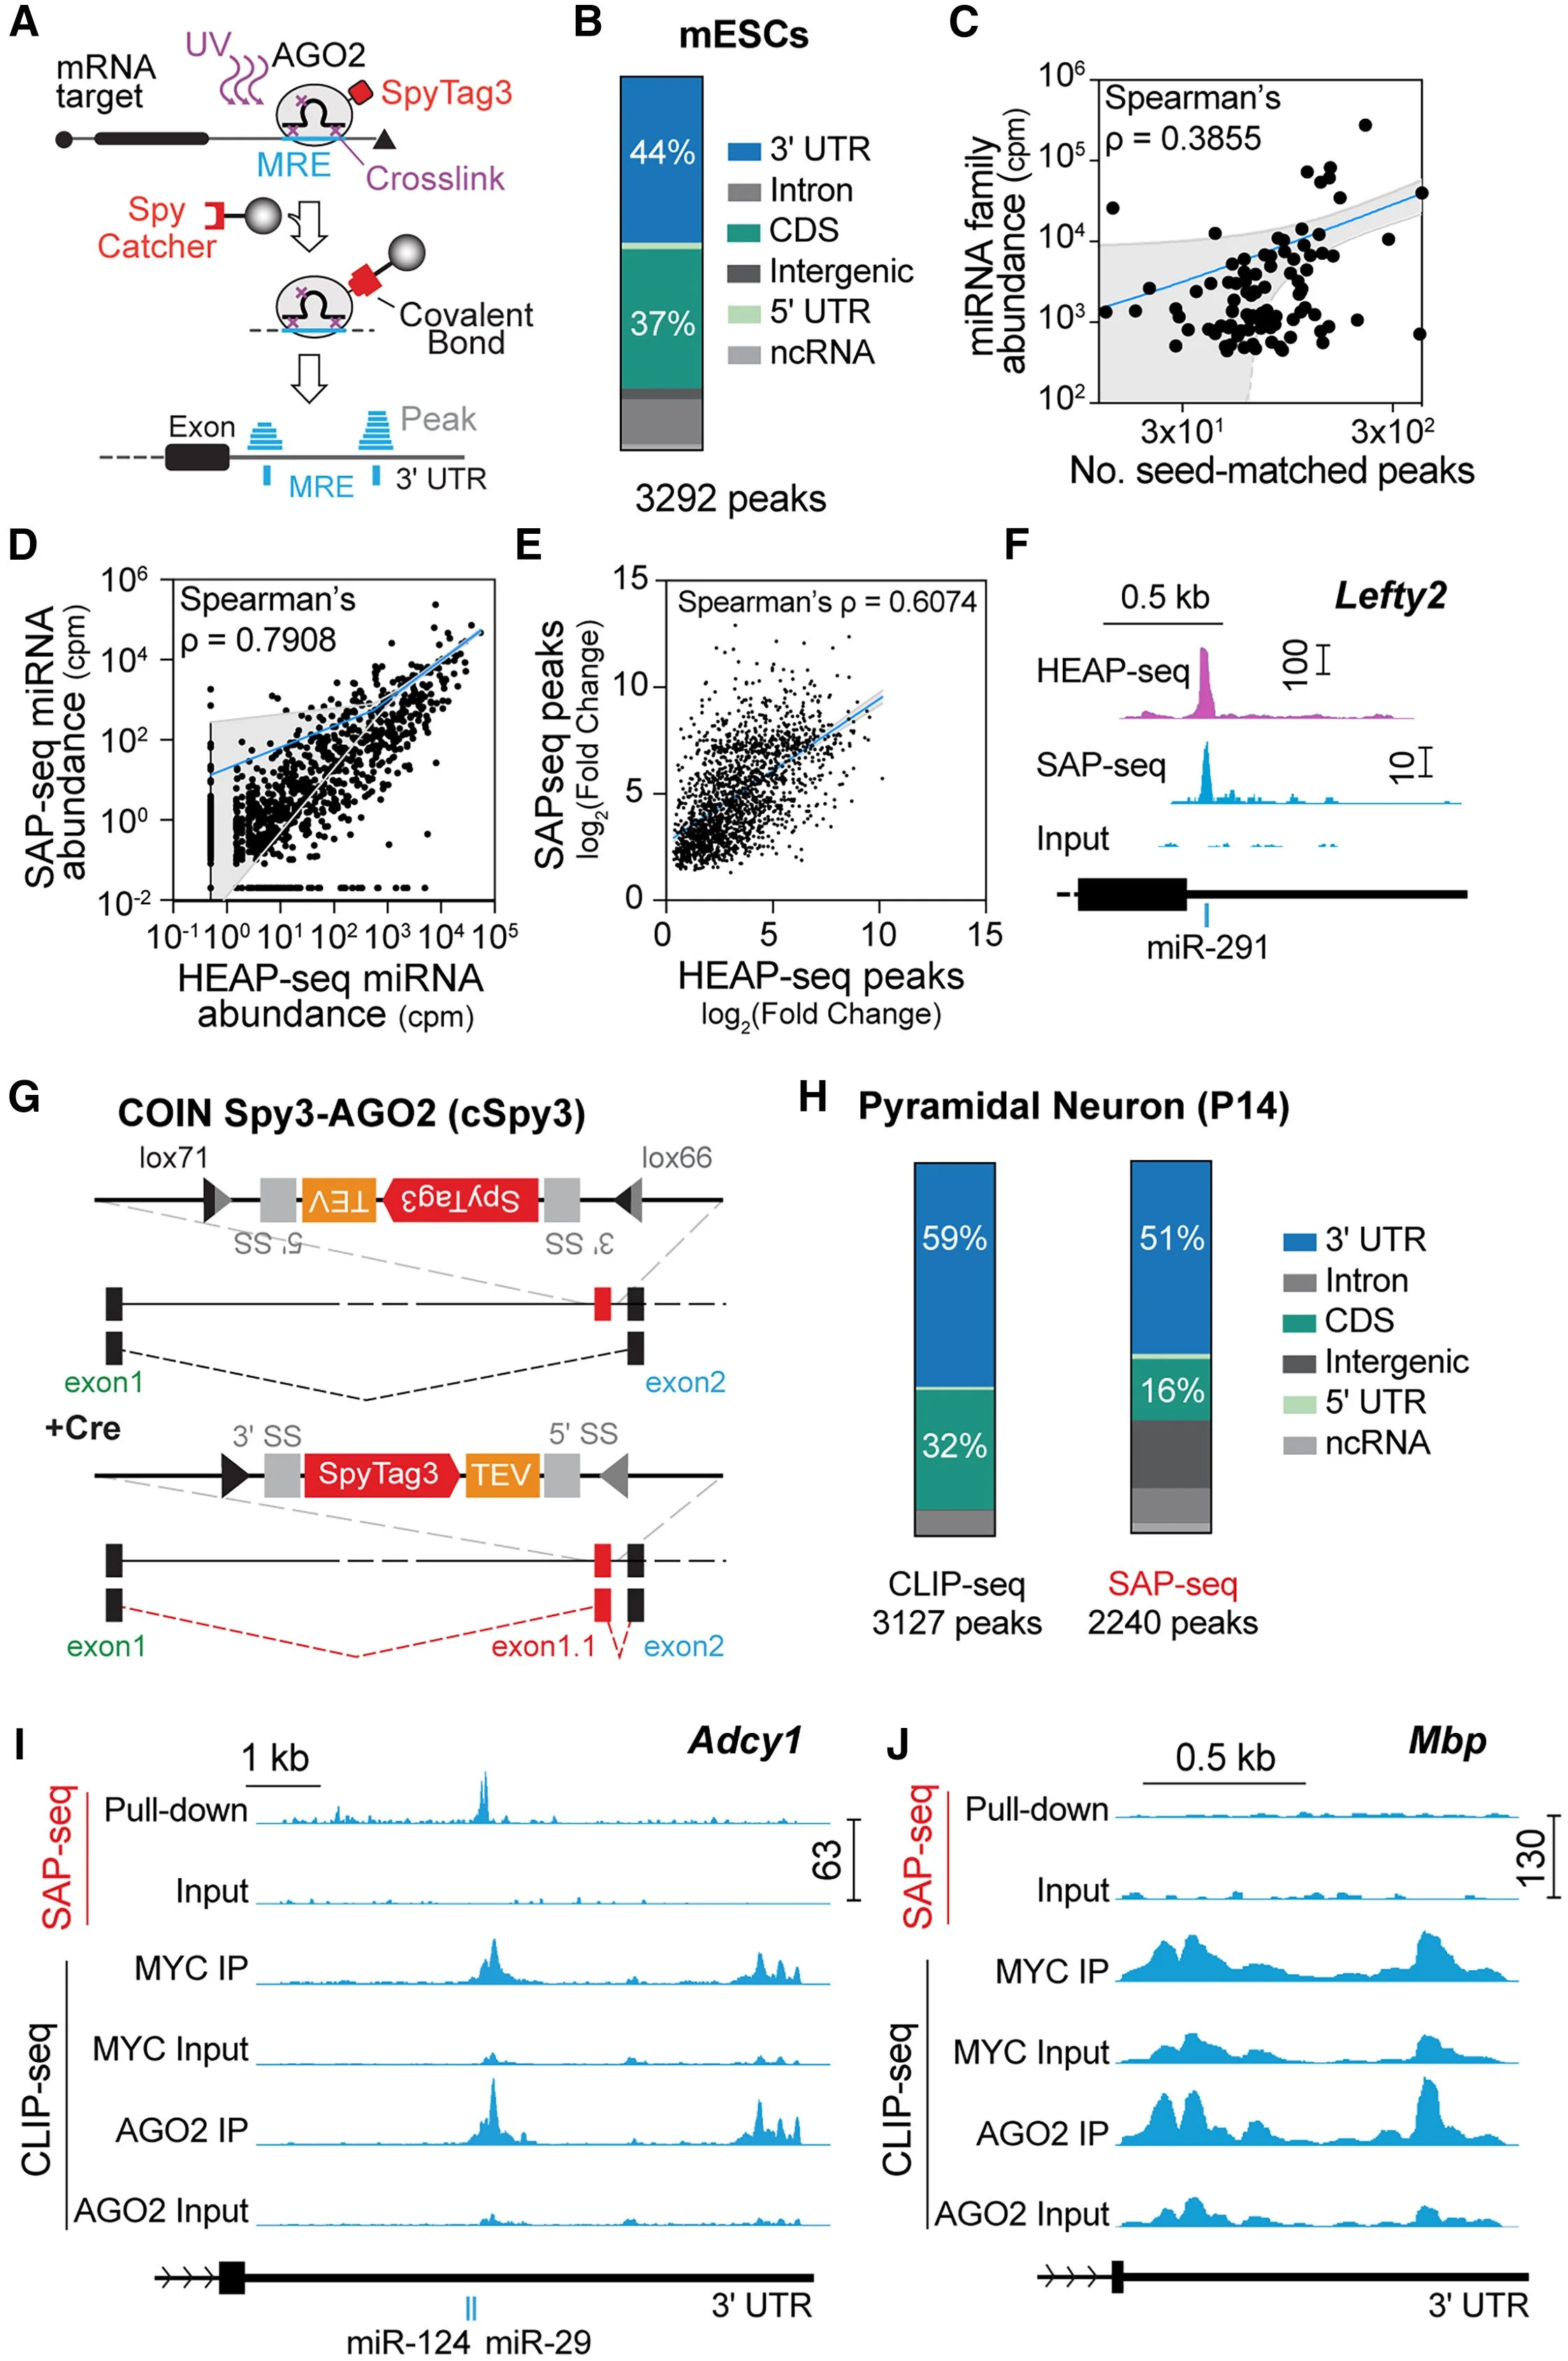
Figure 2. Cell type-specific MTI mapping. A. SAP-seq. AGO2 is tagged with SpyTag3. The AGO2-miRNA-target complex is crosslinked with UV. RNase digests the target fragments not protected by AGO2. SpyCatcher3 beads are used to pull down AGO2. Pulled-down target fragments and miRNAs are sequenced. The target fragments form peaks, often in the 3′ UTR. B. Frequency across genomic annotations of the peaks mapped in E14 mESCs. C. The number of SAP-seq peaks with 7-mer or 8-mer seed matches to the top 100 expressed miRNA families vs. the abundance of the corresponding miRNA family. D. Pairwise comparison of SAP-seq and HEAP-seq miRNA reads. E. Pairwise comparison of SAP-seq and HEAP-seq target fragment reads. F. Genome browser view of peaks identified in the Lefty2 3′ UTR. Both HEAP-seq and SAP-seq identify a peak that is assigned to miR-291. G. Schematic of the conditional by inversion (COIN) strategy used to generate the cSpy3-AGO2 line. H. Frequency across genomic annotations of the peaks mapped from P14 PNs with SAP-seq and CLIP-seq. I. Genome browser view of peaks identified in the Adcy1 3′ UTR. J. Peaks identified in the Mbp 3′ UTR. Mbp is a major constituent of myelin sheaths made by oligodendrocytes; therefore, it should not be expressed in neurons. From Zolboot*, Xiao* et al. Neuron 2025.
3. Measuring translation with single-cell and isoform sensitivity. The remarkable diversity of brain cell types in mammals requires single-cell approaches (e.g., scRNAseq) to map gene expression. Yet, due to extensive post-transcriptional regulation, mRNA is a poor predictor of protein levels in neurons11. Thus, measuring only the transcriptome is inadequate for fully understanding neuronal development and function. While direct measurement of protein levels at single-cell resolution would be ideal, it remains technically challenging and low resolution. To overcome this, in collaboration with Gene Yeo (UCSD) and supported by a BRAIN Initiative grant, we adapted Ribo-STAMP (Surveying Ribosome Targets by APOBEC-Mediated Profiling) for usage in the mammalian brain (Figure 3). We demonstrated that Ribo-STAMP can detect rapid changes in translation, identify translational differences between cell types, measure translation at single-cell resolution and, paired with long-read RNAseq, measure the translation potential of individual gene isoforms (Sison*, Zampa*, Kofman*, et al. Nature 2026). We believe that this technology will be a game-changer for the field, helping to generate new hypotheses on the post-transcriptional mechanisms instructing the development and function of brain cell types.
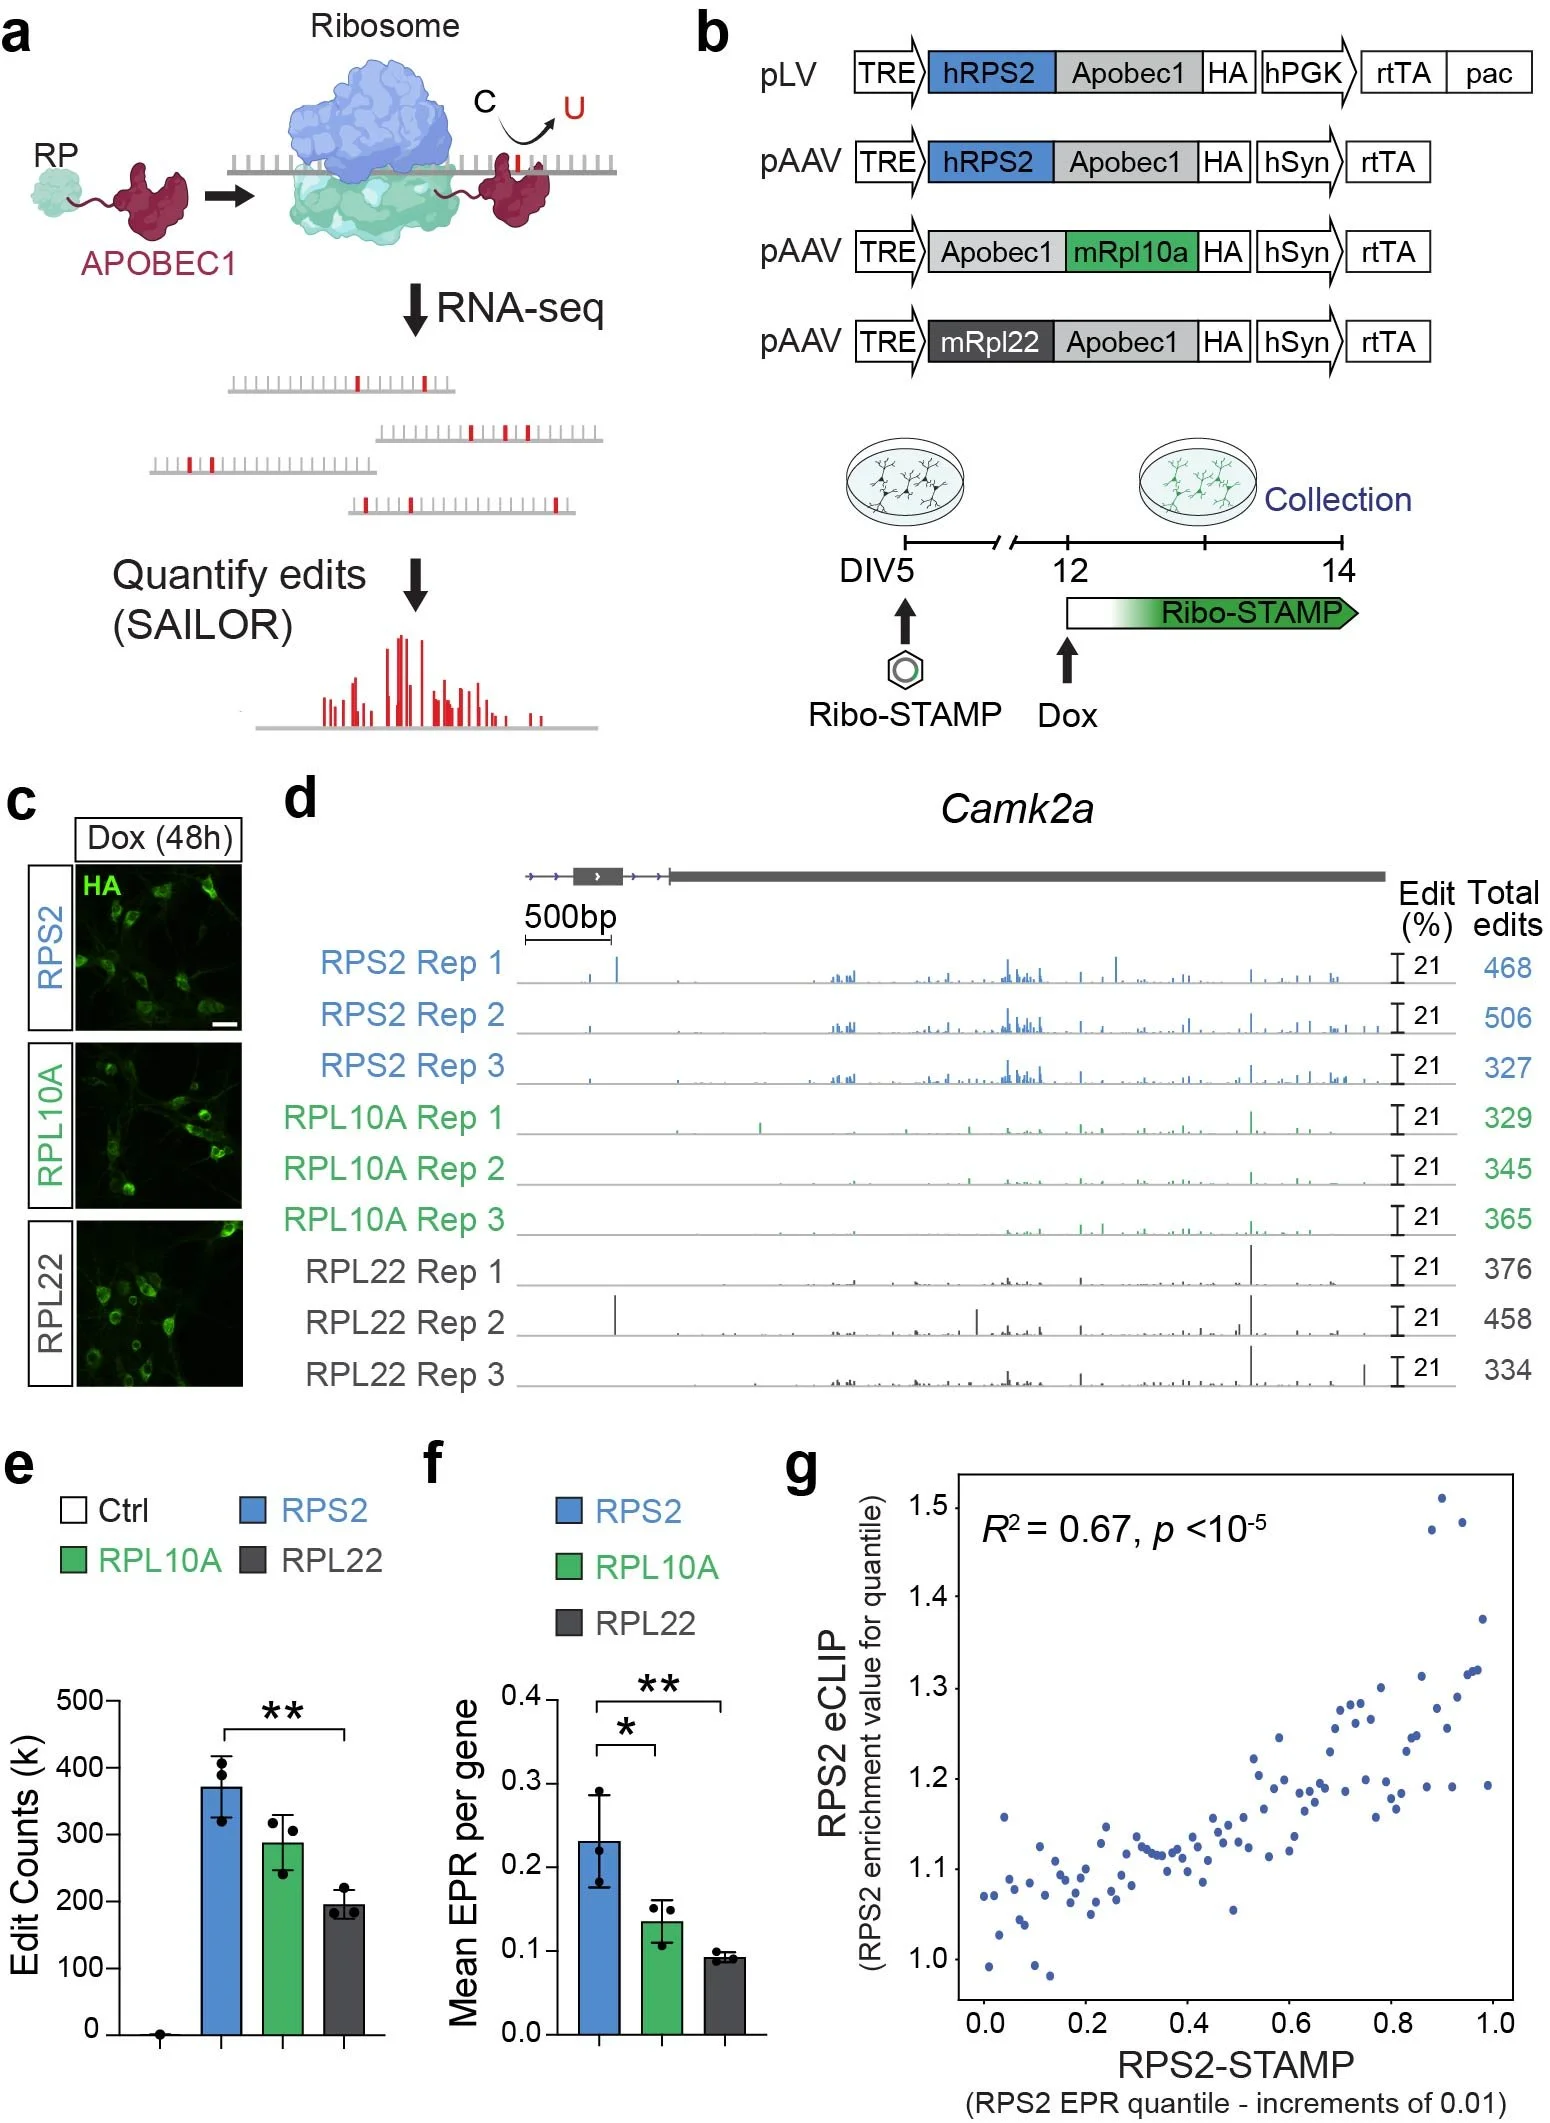
Figure 3. Ribo-STAMP in neurons. A. The Ribo-STAMP technology fuses rAPOBEC1 to a ribosomal protein (RP), inducing C-to-U edits at or near ribosome binding sites on mRNAs. Edits are detected by standard RNA-seq and quantified using the SAILOR analysis pipeline. B. Schematic of the original lentiviral (lentiviral plasmid, pLV) and neuron-specific AAV Ribo-STAMP expression vectors (pAAV, top). Schematic of the experimental paradigm for Ribo-STAMP expression in primary neurons (bottom). C. Detection of Ribo-STAMP variant expression with haemagglutinin (HA) tag immunocytochemistry. D. Integrative genome viewer (IGV) browser tracks showing edit peaks from the tested Ribo-STAMP variants on the Camk2a gene from biological replicates. Edit peaks are shown as a percentage of edited Cs, and total Camk2a edit counts for each condition and replicate are reported on the right. E. Total edit counts deposited by the Ribo-STAMP variants and in uninfected neurons (control, Ctrl). F. Mean EPR per gene levels. G. Correlation between RPS2 eCLIP and RPS2-STAMP EPR. From Sison*, Zampa*, Kofman*, et al. Nature 2026.